.png?width=1459&height=292&name=__DetechtionAi_slategrey-red_TRANSPARENT%20(1).png)
Purpose
This article explains how to create, edit, delete, and export Custom Reports in Enalysis. Custom Reports allow you to build personalized report views using the data and metrics most important to your operation.
Who This Applies To
- Enalysis users
- Operators
- Engineers
- Asset Managers
- Users who need customized reporting and data analysis
Steps
Access the Custom Reports Page
- Log in to Enalysis.
- Select the appropriate company from the company selector.
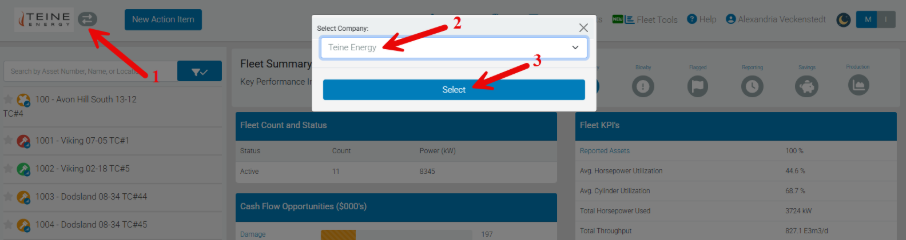
- Verify the correct company logo appears.

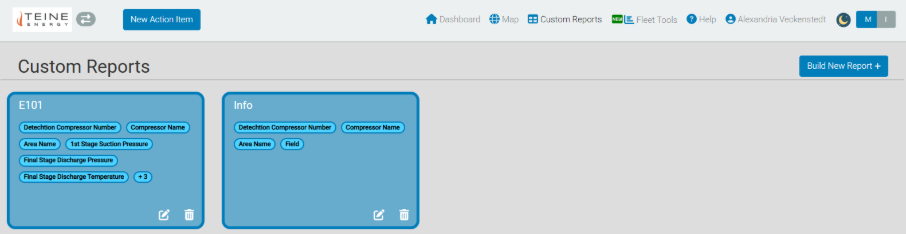
- Select Custom Reports from the top navigation menu.

- Existing custom reports will appear on the Custom Reports page.
Create a New Custom Report
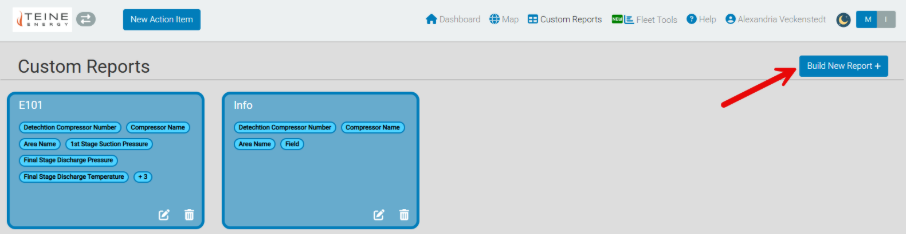
- Select Build New Report +.
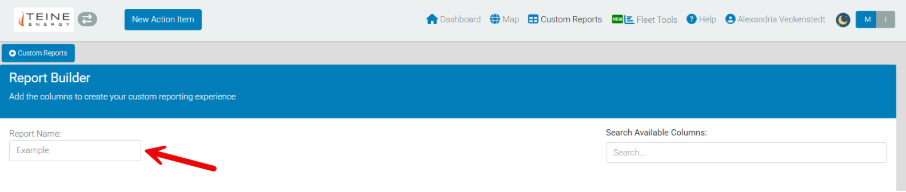
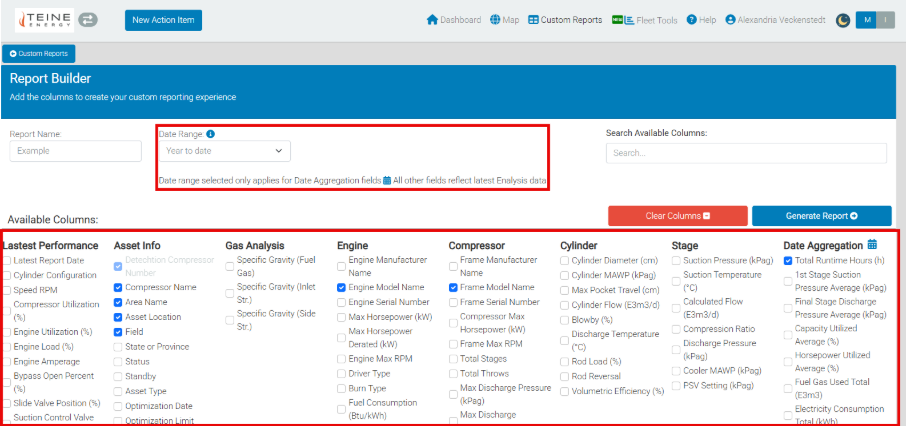
- Enter a name for your report.
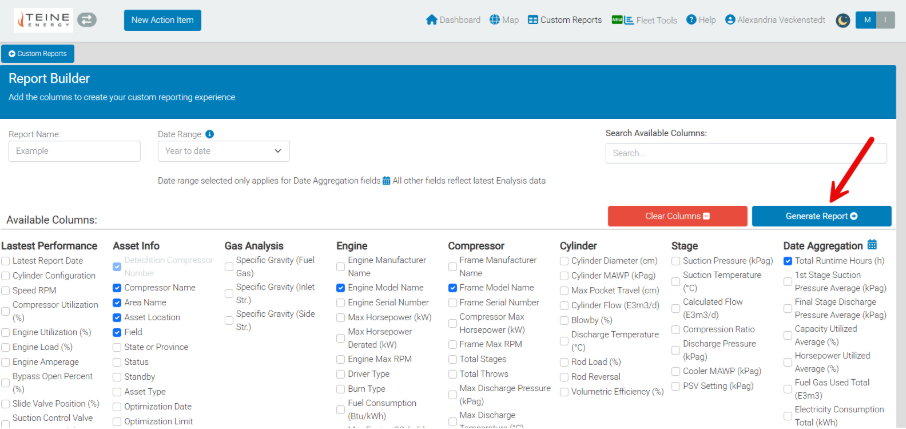
- Select the fields and metrics you want to include from the available categories.
- If you choose metrics from the Date Aggregation section, select a reporting period:
- Last 7 Days
- Last 30 Days
- Year to Date
- Custom Date Range
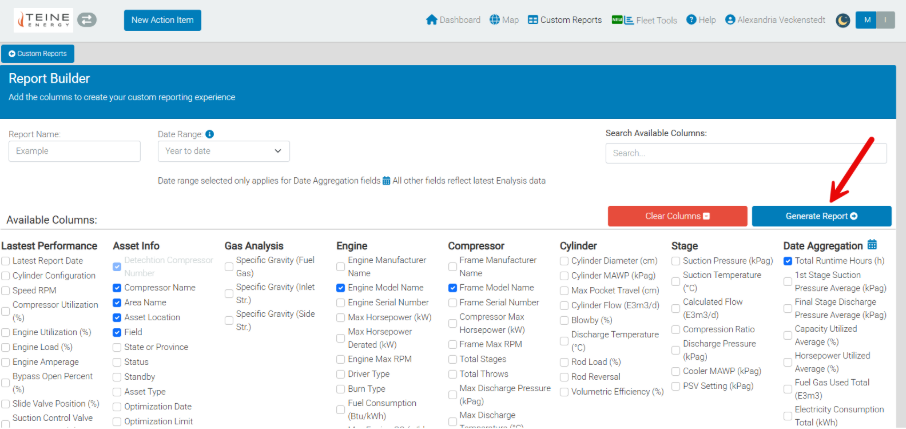
- Select Generate Report to create the report.
Organize Report Columns
When selecting metrics, keep in mind:
- Columns are displayed in the same order they are selected.
- Choose metrics in the order you want them to appear in the final report.
Export a Report
After generating a report:
- Review the report results.
- Select Export as Excel.
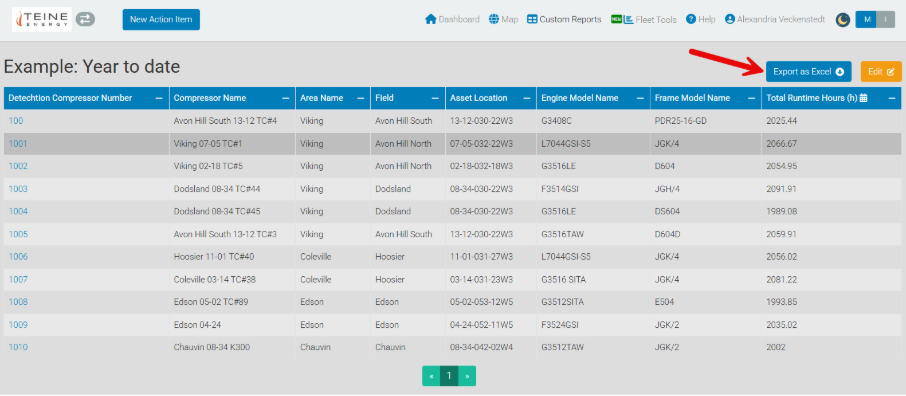
- The report will be downloaded as an Excel file for offline analysis and sharing.
Edit an Existing Custom Report
- Navigate to the Custom Reports page.
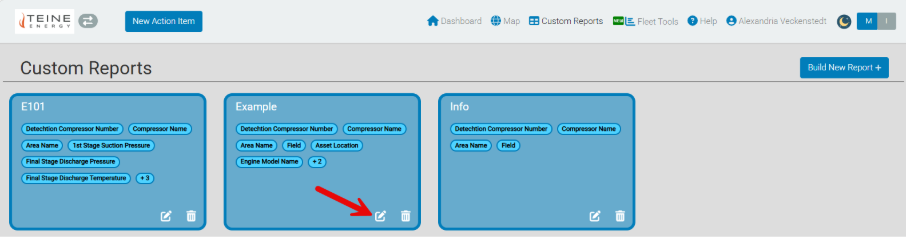
- Select the Edit icon on the report you want to modify.
- If the report is already open, select Edit.
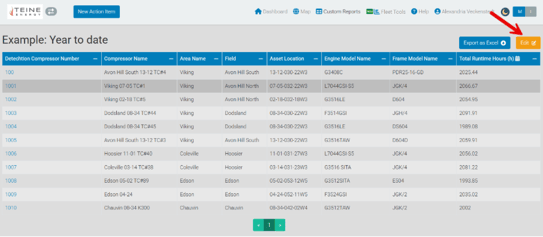
- If the report is already open, select Edit.
- Add, remove, or rearrange the desired metrics.
- Select Generate Report to apply your changes.
Delete a Custom Report
- Navigate to the Custom Reports page.
- Locate the report you want to remove.
- Select the Delete icon.
- Confirm the deletion if prompted.
Understanding Date Aggregation
Some custom report metrics use date aggregation to summarize information over a selected time period. These calculations may display:
- Totals
- Averages
- Minimum values
- Maximum values
Depending on the metric selected and reporting period chosen.
Because aggregation methods vary between metrics, values displayed in a custom report may not always match data viewed elsewhere in Enalysis without using the same aggregation period and calculation method.
Helpful Tips
- Plan your column order before building the report since metrics appear in the order selected.
- Use date aggregation fields when tracking historical performance trends.
- Export reports to Excel for additional analysis, filtering, or sharing.
- Save frequently used report layouts to reduce future reporting effort.
Related Articles
- What Is Enalysis?
- How Do I Review the State of My Assets?
- What Is a Loading Curve and How Can I Use It?
- How Do I Perform Quality Checks on My Assets?
Still Need Help?
If you need assistance creating or interpreting Custom Reports, contact Detechtion Support.
Contact Support
Enalysis Support
- Phone: 403.250.9220
- Email: erc@detechtion.com