.png?width=1459&height=292&name=__DetechtionAi_slategrey-red_TRANSPARENT%20(1).png)
Purpose
This article explains what a Detechtion Loading Curve is, how to interpret the information it provides, and how it can be used to identify compressor optimization opportunities in Enalysis.
Who This Applies To
- Enalysis users
- Operators
- Production Engineers
- Compressor Specialists
- Anyone reviewing compressor performance and optimization opportunities
Steps
What Is a Loading Curve?
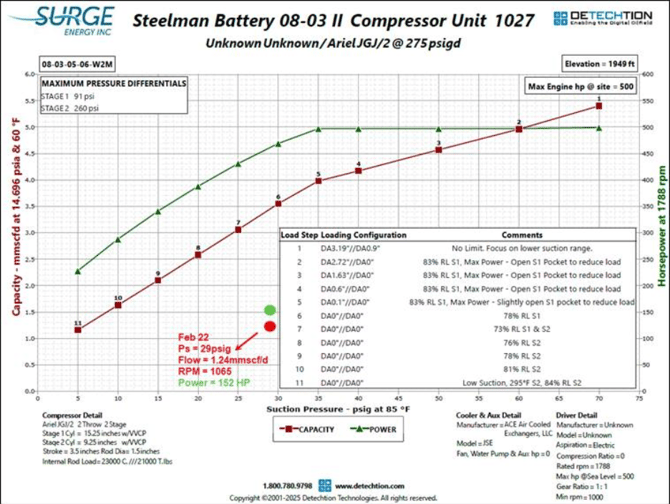
A Detechtion Loading Curve shows the maximum capacity a compressor can achieve at different suction pressures under a specific set of operating conditions. The curve also displays the estimated power required to achieve that capacity.
A loading curve considers factors such as:
These variables can be adjusted to evaluate "what-if" scenarios or represent current operating conditions.
Understanding the Loading Curve
When viewing a loading curve:
- The red axis displays compressor capacity.
- The green axis displays required power.
- Each load step represents a specific compressor configuration and operating point.
A loading curve helps determine:
- Maximum achievable throughput
- Available operating flexibility
- Compressor limitations
- Configuration changes required to meet a production target
Compare Current Performance to the Curve
To evaluate compressor performance:
- Identify the compressor's current suction pressure.
- Identify the current flow rate.
- Plot the operating point against the loading curve.
- Compare the operating point to the curve line.
Interpret the Results
Operating Below the Loading Curve
If the operating point falls below the curve, the compressor may have additional available capacity.
Potential opportunities may include:
- Increasing throughput
- Redirecting additional gas to the compressor
- Increasing run speed
- Adjusting compressor pockets or clearance settings
Reducing Suction Pressure
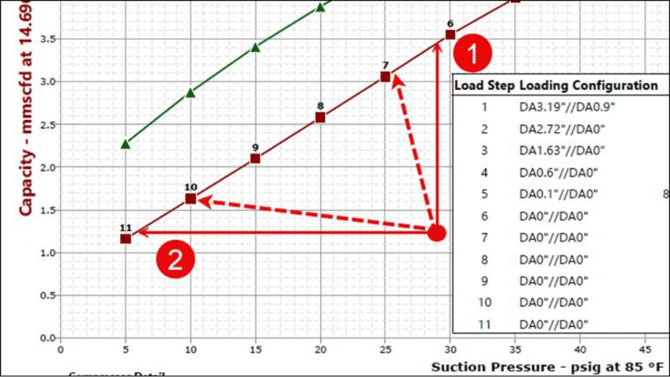
If additional gas is not available, the loading curve can help determine whether the compressor could maintain the same flow rate at a lower suction pressure. This may be achieved through configuration changes such as increasing driver speed or modifying compressor clearance settings.
Evaluate Optimization Opportunities
The optimal operating point typically falls somewhere between:
- Maximizing throughput at the existing suction pressure
- Maintaining throughput while reducing suction pressure
Loading curves help users evaluate these possibilities and select an operating strategy based on field conditions and business objectives.
Understand Operating Limitations
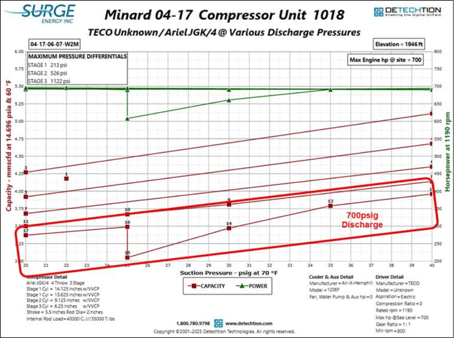
Detechtion Loading Curves identify common operating constraints that may impact compressor performance, including:
- High discharge temperatures
- Power limitations
- High rod loads
- Low volumetric efficiency (VE)
- Low reversals
- PSV limitations
Helpful Tips
- Use loading curves when evaluating compressor optimization opportunities.
- Always compare actual operating conditions against the curve assumptions before making decisions.
- Review load step configurations to understand what operational changes are required to achieve a target flow rate or suction pressure.
- Loading curves are most effective when used alongside Enalysis reports and current operating data.
Still Need Help?
If you need assistance interpreting a loading curve or evaluating compressor optimization opportunities, contact Detechtion Support.
Support Information
Existing Customers
Enalysis Support
- ERC — Email: enbasesupport@detechtion.com | Phone: 403-250-9220